Summary of Speed Indicator Device (SID) and Community Speed Watch (CSW) Activity
For the period 23rd August to 29th November 2023
|

|

|
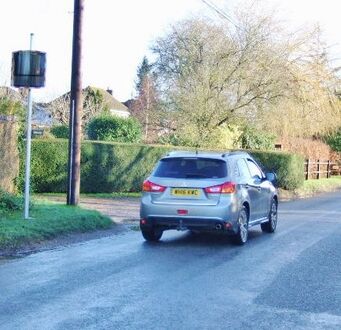
Location: The SID was positioned at Stratford Tony Road from 23rd August to 4th October. It was moved to Salisbury Road Secondary until 27th October. It was then moved back to Tottens Farm until 29th November.
I would like to take this opportunity to thank Carola and Chris Thomas, Jonathan Woolven and Philip Alfry for their amazing support in helping to maintain and relocate our SID around the different locations in our communities.
Please see the tables below for details of traffic speeds and volumes during this period.
For the latest on Community Speed Watch
For more information regarding approved SID sites in Coombe Bissett and Homington villages please refer to the SID location Power Point guide.
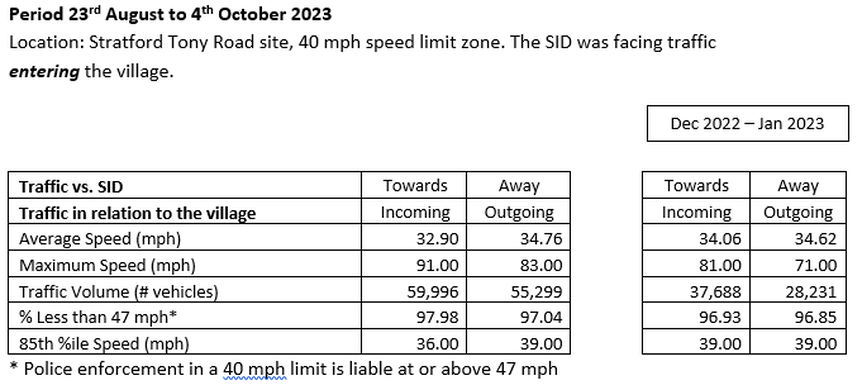
All metrics show continued improvement at this location, with the exception of maximum speeds. Reference to the latest PDF saved on the Stratford Tony Tab shows that these high speeds were recorded at the very beginning of the session. Daily average vehicle volumes appear to have increased again (our last report noted a reduction in the summer compared to the previous year).
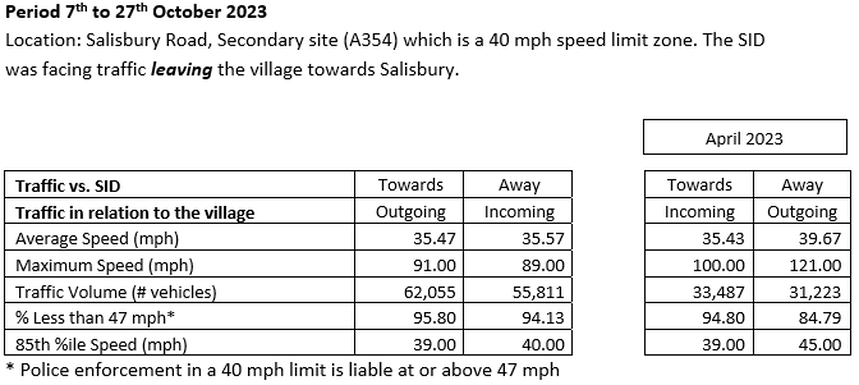
When the SID was at this location in April it was facing traffic entering the village from Salisbury. It has been noted for some time that drivers entering the village generally observe the speed limit but that drivers leaving Coombe Bissett show less regard for the speed limit (see statistics on the right above). The SID was located facing traffic leaving the village during the latest session. As expected, incoming traffic continued to observe the speed limit whereas drivers leaving the village paid much greater attention, thanks to the Speed Sign facing them.
Please note: Our attempts to have this site approved as a Community Speed Watch location are ongoing. A Road Traffic Survey was conducted in June but the results showed an anomaly in the data. Another survey will be conducted at some time in the future.
Please note: Our attempts to have this site approved as a Community Speed Watch location are ongoing. A Road Traffic Survey was conducted in June but the results showed an anomaly in the data. Another survey will be conducted at some time in the future.

The latest statistics show that positioning the SID so that it faces traffic leaving the village provides a better deterrent to speeding drivers at this location. Nevertheless, the 85th Percentile speeds warrant speed enforcement for traffic in both directions. We have been advised that the Speed Enforcement Team conducted a session at Tottens Farm on 13th October but did not stay for very long due to light traffic volumes. We continue to submit our SID data to Wiltshire Police and hope that we can persuade them that excessive speeds are caused precisely by low traffic volumes at this location.
Detailed PDF reports:
Please refer to the tabs for Tottens Farm and Blandford Road for a more detailed analysis of traffic data recorded by the SID, which is presented in PDF report format. Guidance Notes to each section of the PDF reports are provided below this summary.
Note: Our SID does not have GPS and therefore its reports are location agnostic. References in reports to Incoming and Outgoing traffic refer to traffic coming towards the device (Incoming) and traffic going past the device in the opposite direction (Outgoing).
Wiltshire Speed Indicator Device Data Sharing Pilot
SID Data Sharing has been rolled out across Wiltshire with effect from 22nd June. There are over 100 SIDs installed in towns and parishes across Wiltshire. Under the first phase of the initiative, communities with Evolis and MessageMaker Speed signs have been asked to submit their data. So far, 68% of Evolis SID users and 64% of MessageMaker users registered and are participating in this initiative. Data from these speed signs is now used to prioritise the deployment of Wiltshire Police’s Speed Enforcement resources.
SID Data Sharing has been rolled out across Wiltshire with effect from 22nd June. There are over 100 SIDs installed in towns and parishes across Wiltshire. Under the first phase of the initiative, communities with Evolis and MessageMaker Speed signs have been asked to submit their data. So far, 68% of Evolis SID users and 64% of MessageMaker users registered and are participating in this initiative. Data from these speed signs is now used to prioritise the deployment of Wiltshire Police’s Speed Enforcement resources.
Please see the Roll-out presentation prepared by John Derryman, Office of the Police and Crime Commissioner, Wiltshire. There is also a brief video of the SID data sharing initiative prepared by the OPCC Communications team.
www.instagram.com/reel/CvwhcGzMjFt/?igshid=MTc4MmM1YmI2Ng==
www.instagram.com/reel/CvwhcGzMjFt/?igshid=MTc4MmM1YmI2Ng==
| sid_data_roll-out_-_final_pdf.pdf |
|
Community Speed Enforcement Officer (CSEO) Team
The CSEO team have been conducting roadside speed enforcement sessions in Coombe Bissett, using the CSW Deegan House location. Debbi Hide of the CSEO team advises she has carried out speed checks at 9:30 to 10:30 am; 12 pm to 1 pm and 2 pm to 3 pm. A summary of CSEO reports is as follows: |
|
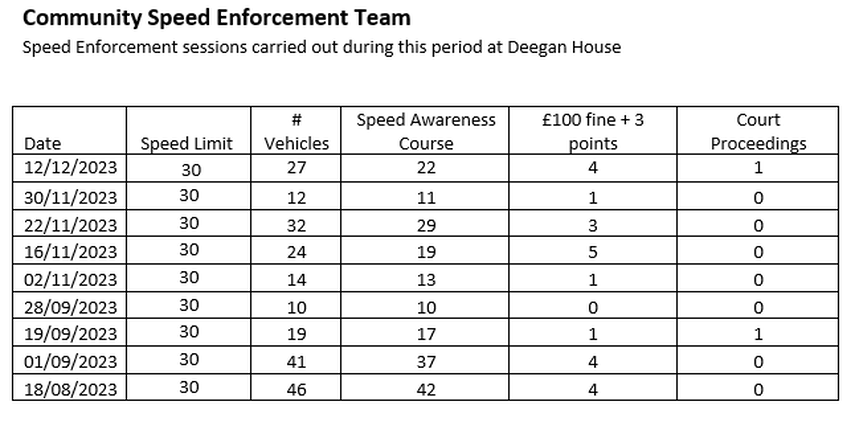
The following is a graphical representation of all CSEO sessions carried out since 18th April this year.


Community Speed Watch (CSW) Update
A total of 35 Speed Watch sessions were conducted between 11th August and 28th November 2023
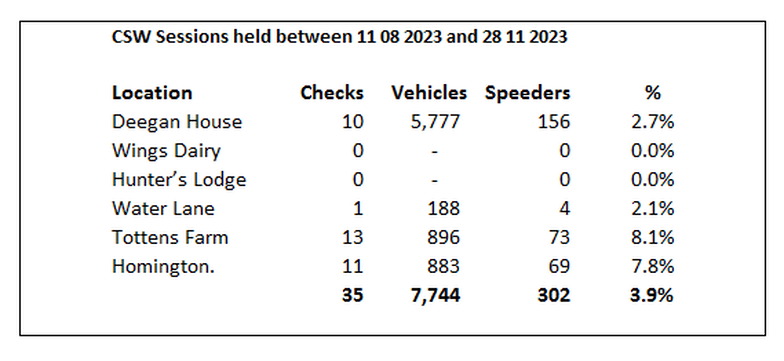
The number of CSW sessions has remained more or less constant, averaging 2-3 sessions per week. 302 drivers have been successfully reported to CSW HQ. Details of the number of warning letters generated by Wiltshire Police are available on the PCC’s website. Please use the following Link
www.wiltshire-pcc.gov.uk/your-pcc/campaigns/road-safety/
Special thanks goes to the following members of the our Community Speed Watch Team who have given up their time to help conduct speed watch sessions this year:
Gillian Irving, Kim Byatt, Lynnie Reed, Gerald Bundy, Brian Childes, David Germain, Rupert van der Horst, Michael Wardroper and Theresa Tidmarsh (Coombe Bissett)
Gill and Chris Humphreys, Sol Rimer and Simon Boxall (Homington)

We continue to try and cover as much of the community as possible. As you can see, we have been unable to run sessions in some sites. If you would like to volunteer to become part of the Community Speed Watch team, and help us in our efforts to improve road safety in the parish, please don’t hesitate to call Adrian Turnbull on 07747 620210 or email me at turnbull_adrian@hotmail.com .
Thank You!
Thank You!
NOTE EXPLAINING INFORMATION IN PDF REPORTS
OF SPEED INDICATOR DEVICE (SID) ACTIVITY
COVER PAGE
The start and end dates for the period the device has been active at a location are shown on all pages.
Location: Records where the SID device was positioned during the report period and is shown on all pages.
Note: The Parish Council agreed that the SID should serve as much of the community as possible. Sites have had to be agreed by Wiltshire Council. At present there are a total of 7 approved sites. Details of exactly where each site is located are available in a separate document.
Comments: Details here show the speed limit for the site where the SID was located and the direction of traffic the SID was monitoring at that location:
- Inbound relates to traffic coming into the village
- Outbound relates to traffic leaving the village
The Comments section also states whether the sign was actively displaying the speed information to oncoming traffic or if it was in ‘Spy Mode’. Spy Mode records traffic information but does not display speeds, and is used to baseline traffic speeds at the start of the period.
PAGE TWO: AVERAGE SPEEDS
The Average Speeds graph includes two averages:
- An ‘average by time period’, which is displayed as a curve on the graph. (one curve per direction: ingoing/outgoing).
- An overall average which is displayed as a numeric value just below the graph.
The ‘average by time period’ corresponds to the arithmetic average calculated on the speeds recorded between the start/end dates. They are presented on a default time period of 30 minutes. The overall average corresponds to the arithmetic average of all the speeds included between the starting/ending dates on the time period selected for the PDF report. The software sums up all of the recorded speeds, then divides the result by the number of vehicles measured.
Note: References in the PDF report to Incoming direction and Outgoing direction relate to the direction of traffic in relation to the SID. ‘Incoming’ relates to traffic heading towards the device. ‘Outgoing’ relates to traffic going past the device in the opposite direction
PAGE THREE: MAXIMUM SPEEDS
Similar to the information for average speeds, the graphs relating to maximum speeds are displayed in curve and number format.
- The maximum speed recorded per time period are displayed in graph form (oncoming and outgoing are reflected in different colours).
- The maximum speed recorded over the entire time period is shown for each direction as a numeric value just below the graph.
PAGE FOUR: VEHICLES PER HOUR
Graphs show traffic volumes for incoming traffic (Green) and outgoing traffic (Blue) for each 24-hour period covered by the report. Total volumes are shown at the top right of the graph
PAGE FIVE: SPEED DISTRIBUTION FOR INCOMING TRAFFIC
PAGE SIX: SPEED DISTRIBUTION FOR OUTGOING TRAFFIC
In these sections, the recorded speeds are represented in pie chart form, and allow you to see the percentage of vehicles which have, or have not, observed the speed limit.
The first segment shows the percentage of vehicles which are travelling below or at the legal speed limit in that location. The second segment shows the percentage of vehicles which are travelling above the legal limit but approximately within the speed tolerances permitted by Wiltshire Police and Community Speed Watch before drivers may be sanctioned. The remaining segments show the percentage of vehicles travelling at excessive speeds.
PAGE SEVEN: PERCENTILES FOR INCOMING TRAFFIC
PAGE EIGHT: PERCENTILES FOR OUTGOING TRAFFIC
The 85th percentile is an indicator that helps illustrate the behaviour of the majority of drivers. It reflects the speed respected by 85% of motorists and is obtained by stripping out the bottom and top & bottom 7.5% of speeds recorded (i.e. strips out the extremely fast and extremely slow vehicles).
If the 85% threshold is close to the average speed recorded, this indicates that the speeds observed on a road are consistent. If it is not close to the average speed, this means that a significant proportion of drivers are above the average recorded speed.
Note: Wiltshire Police use 85th Percentile speeds to determine whether they should conduct their own Speed Checks in any location. This is normally determined by the use of a Traffic Speed Survey which is sometimes referred to as a Metro Count. It involves two rubber strips placed across the road connected to a recording device. To-date, the Parish Council have had to request Speed Traffic Survey reports on a case by case basis, before any Police enforcement action will be considered.
| coombe_bissett_and_homington_sid_location_-_website.pdf |